


 13 / 152

financial
review
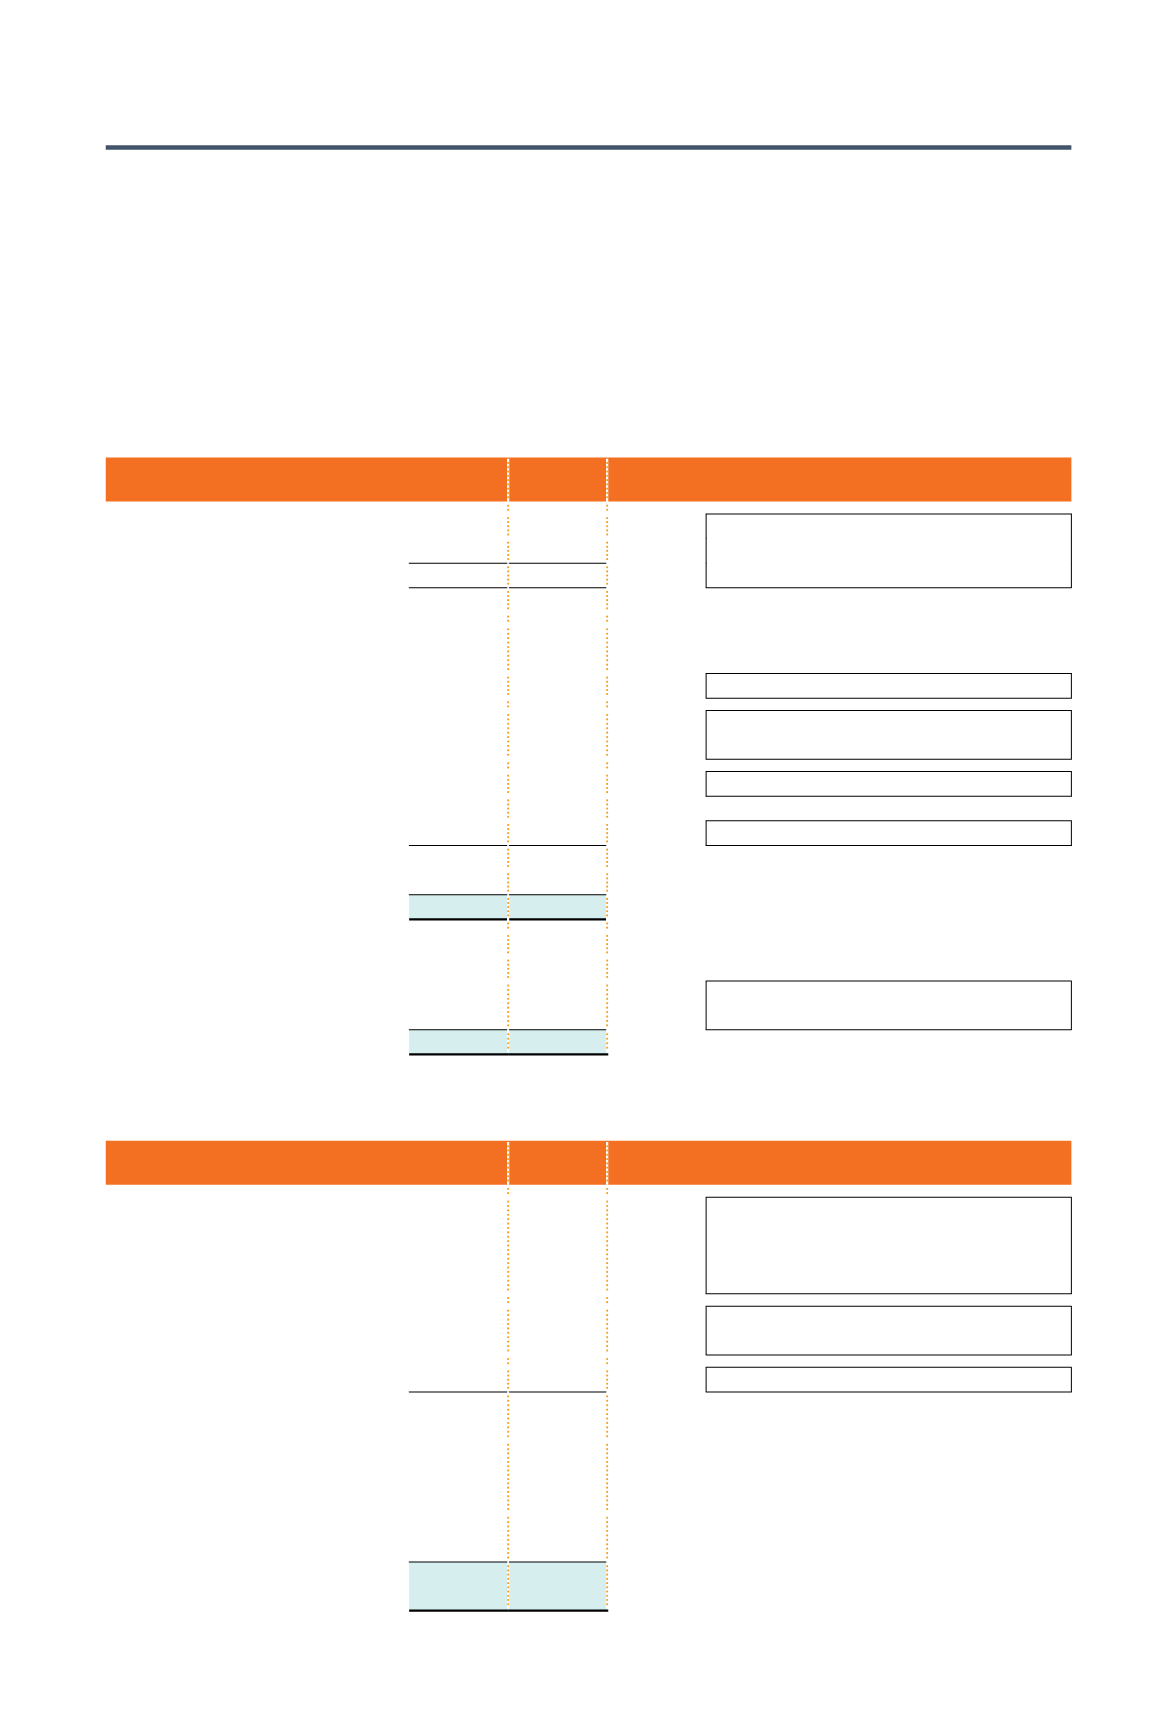
Income Statement
2018
$’000
2017
$’000
Changes
%
Explanatory Notes
Revenue
32,702 5,002
NM Increase in revenue contributed by
fabrication projects and services,
charter income and acquisition of CHO
Cost of goods sold
(23,326)
(2,383)
NM
Gross profits
9,376 2,619
NM
Gross profit margin
29% 52%
NM
Other operating income /
(expenses), net
619
735 -16%
Bargain purchase gain
24,709
- NM Acquisition of CHO
Foreign exchange gain / (loss)
320 (4,039)
NM Gain due to strengthening of USD
against SGD during the year
Administrative expenses
(17,264) (10,598)
+63% In line with increase in revenue
Finance cost
(206)
- NM
Share of results of associates
(3,101)
- NM Acquisition of CHO
Profit / (loss) before tax
14,453 (11,283)
NM
Income tax (expenses) / credit
(138)
593 NM
Profit / (loss) after tax
14,315 (10,690)
NM
Attributable to:
Owners of the Company
17,624 (10,690)
NM
Non-controlling interest
(3,309)
- NM Losses attributed to the 45.02%
minority shareholders of CHO
Profit / (loss) after tax
14,315 (10,690)
NM
Cash Flows
2018
$’000
2017
$’000
Changes
%
Explanatory Notes
Cash used in operating
activities
(9,330)
(16,363)
-43% Shortfall in operating cash flows
funded from internal cash resources
(including warrant proceeds from
rights issue in FY2012)
Cash (used in) / from investing
activities
(49,244)
1,986 NM
Paid $47.1 million for 54.98% in CHO
Cash used in financing activities
- (2,536)
-100% No dividend payment during FY2018
Net decrease in cash & cash
equivalents
(58,574)
(16,913)
246%
Effect of exchange rate
changes on cash and cash
equivalents
852 (3,401)
NM
Cash & cash equivalents at
beginning of year
86,642 106,956 -19%
Cash & cash equivalents
at end of year
28,920 86,642 -67%
* NM denotes Not Meaningful
11
A N N U A L R E P O R T
2 0 1 8