


 18 / 152

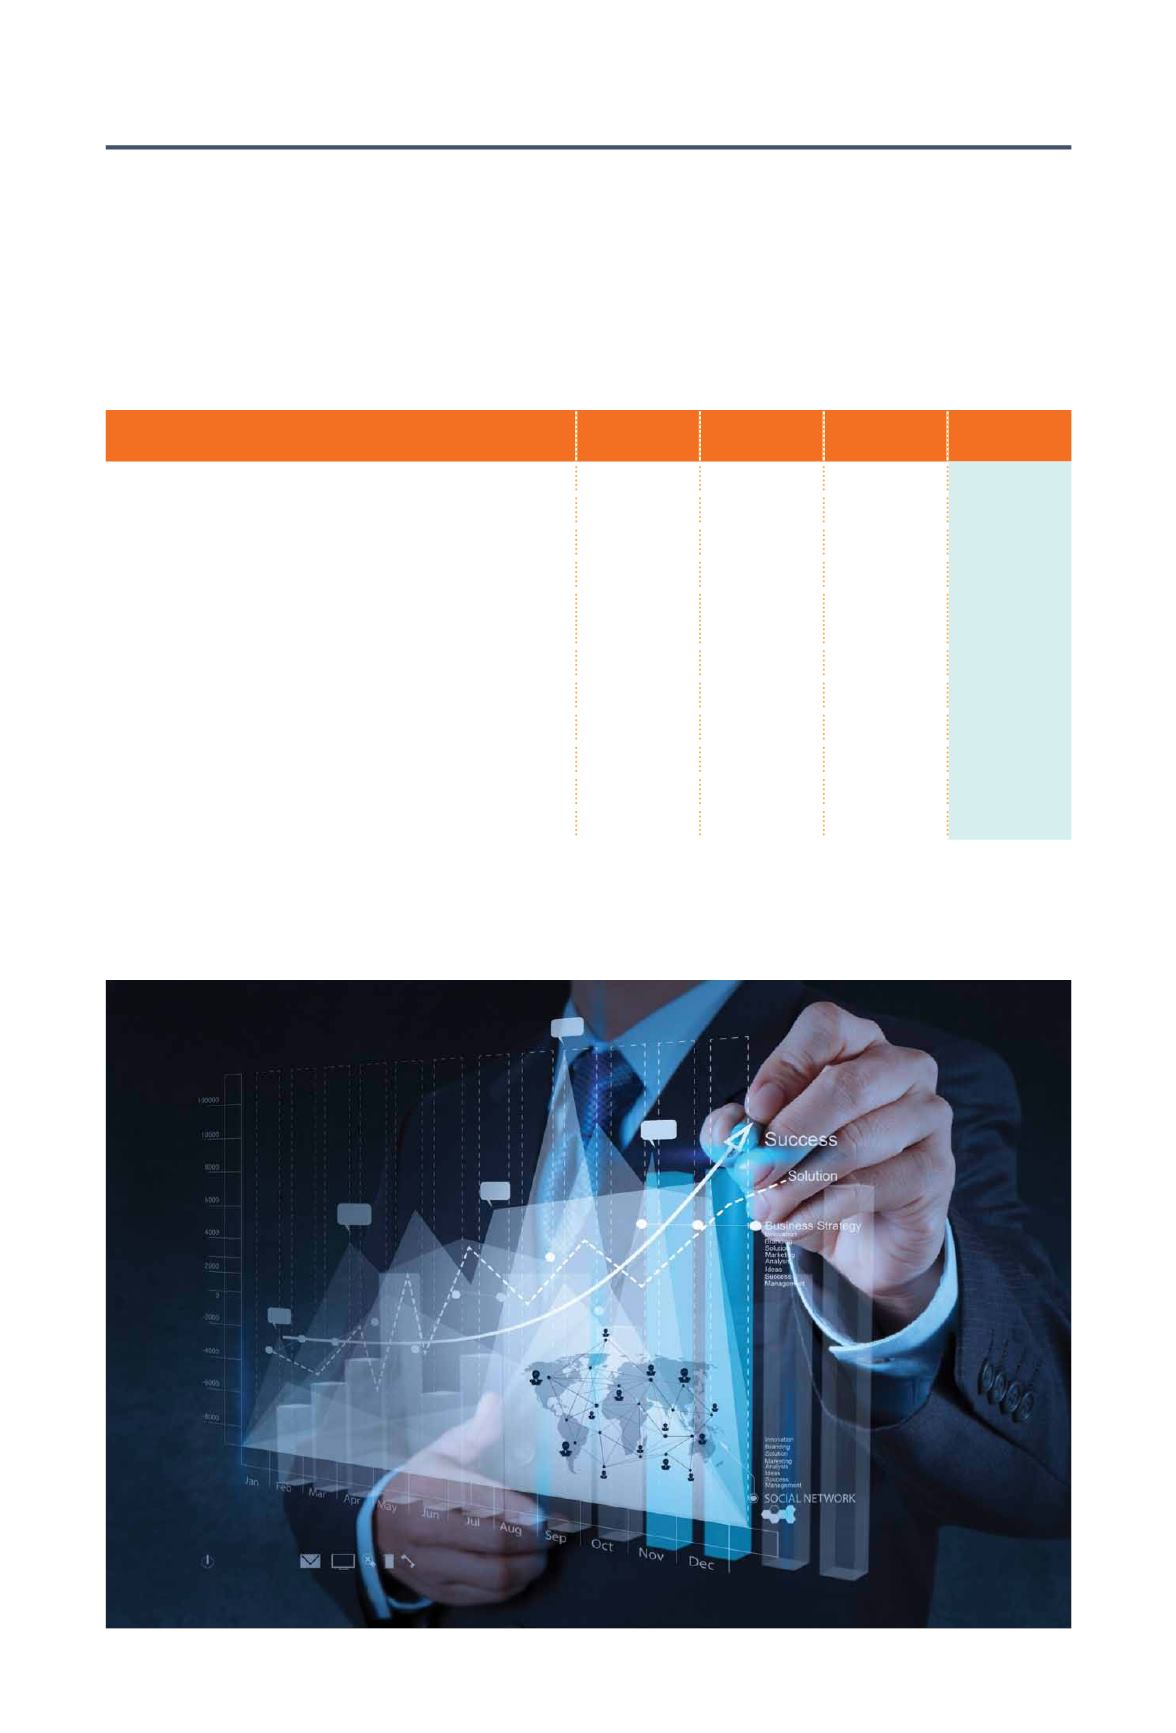
Five-Year Performance
Review
2014
$’000
2015
$’000
2016
$’000
2017
$’000
2018
$’000
Revenue
86,272
54,064
21,520
5,002
32,702
Gross profit
22,707
15,219
5,671
2,619
9,376
Pre-tax profit / (loss)
16,326
11,124
(9,222)
(11,283)
14,453
Net profit / (loss)
13,517
9,164
(8,327)
(10,690)
14,315
Profit / (loss) for the year attributable
to owners of the Company
13,517
9,164
(8,327)
(10,690)
17,624
Shareholders' equity
216,901
228,913 215,667
202,514 220,829
Cash and short-term deposits
168,685 140,070 106,956
86,642
28,920
Earnings per share (cents)*
7.5
4.7
(4.1)
(5.3)
8.7
Diluted earnings per share (cents)*
7.1
4.7
(4.1)
(5.3)
8.7
Cash per share (cents)*
91.4
69.0
52.7
42.7
14.3
* Numbers are adjusted based on the revised numbers of shares as a result of share consolidation in May 2016
16
B A K E R T E C H N O L O G Y
L I M I T E D