


 16 / 152

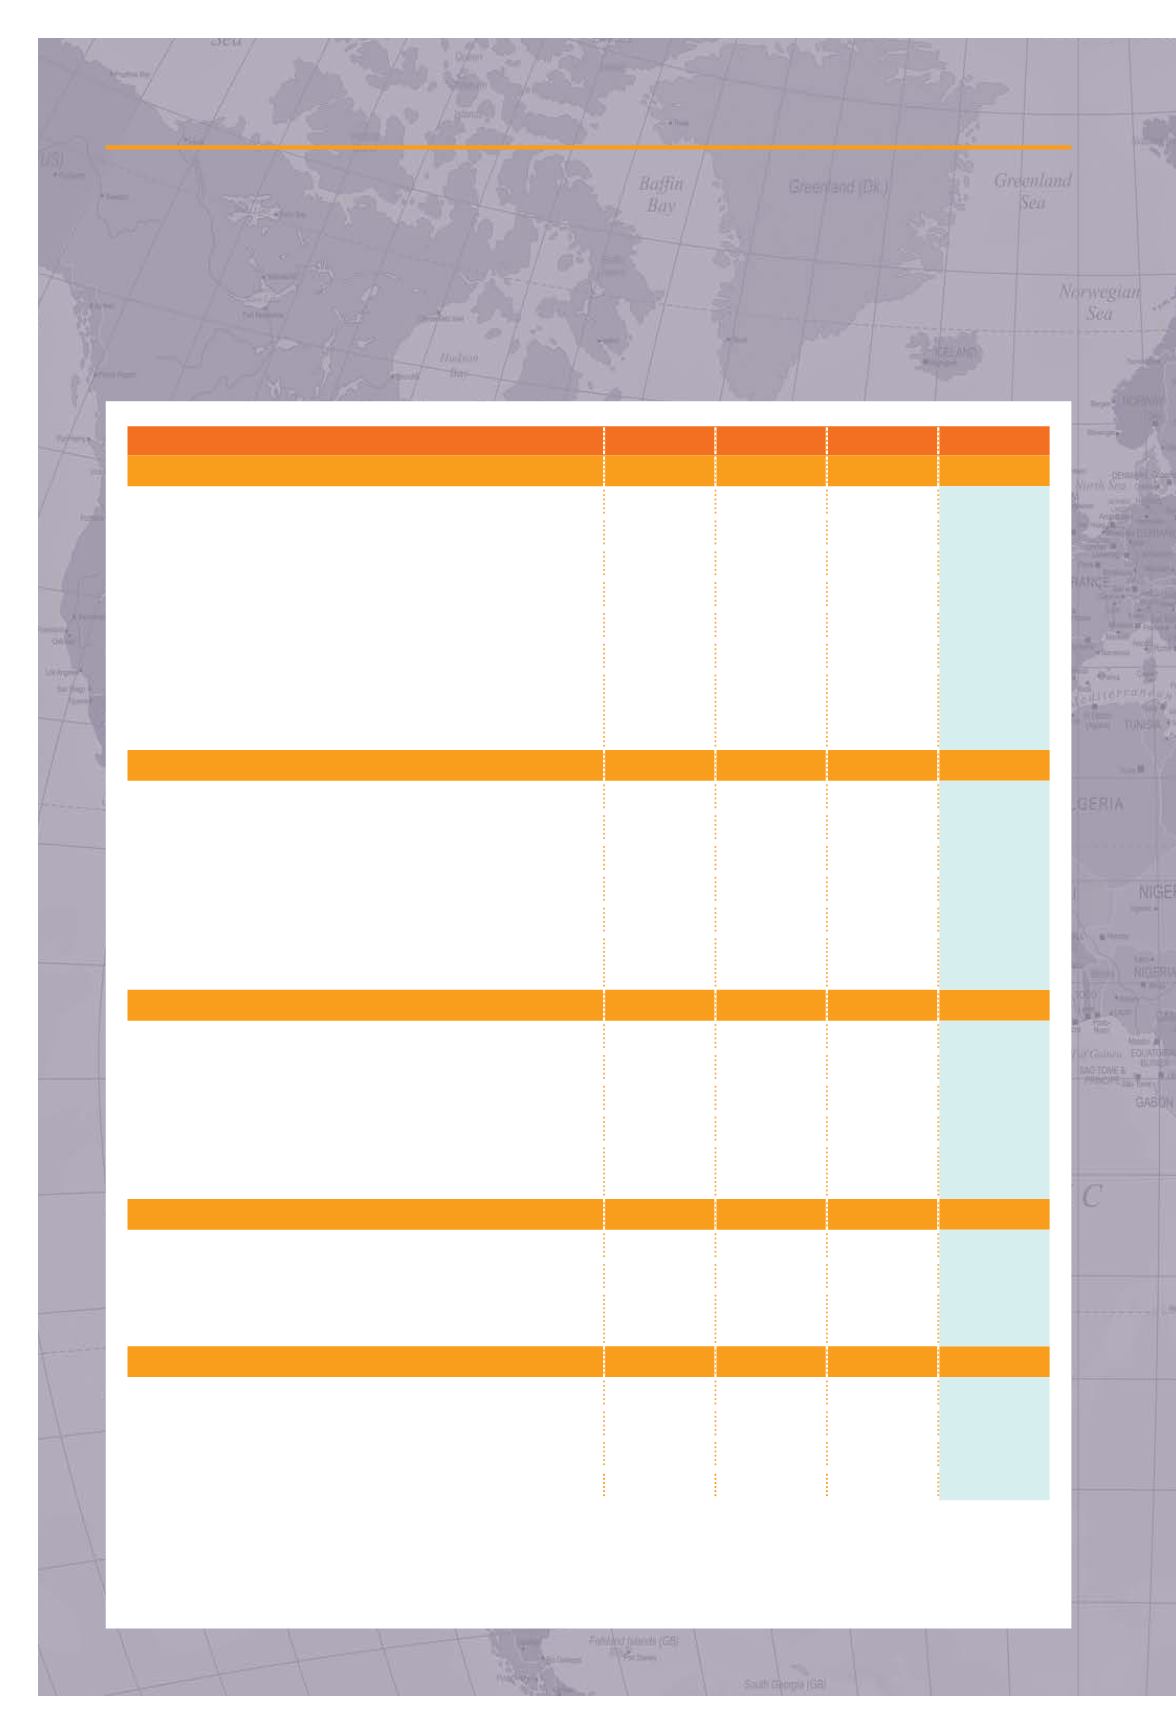
five-YEAR FINANCIAL
HIGHLIGHTS
2014
2015
2016
2017
2018
Financial Performance ($'000)
Revenue
86,272 54,064 21,520 5,002
32,702
Gross profit
22,707
15,219
5,671
2,619
9,376
Share of results from associates
-
-
-
-
(3,101)
Bargain purchase gain
-
-
-
-
24,709
Pre-tax profit / (loss)
16,326 11,124 (9,222)
(11,283)
14,453
Profit / (loss) after tax
13,517
9,164 (8,327)
(10,690)
14,315
Profit / (loss) for the year attributable
to owners of the Company
13,517
9,164 (8,327)
(10,690)
17,624
Financial Position ($'000)
Total assets
236,049 246,066 224,590 208,873 304,579
Cash and short-term deposits
168,685 140,070 106,956 86,642 28,920
Net current assets
188,526 192,481 194,046 84,933 42,953
Loans and borrowings
-
-
-
-
12,514
Shareholders' equity
216,901 228,913 215,667 202,514 220,829
Non-controlling interests
-
-
-
-
55,280
Per Share Data (cents)*
Earnings per share
7.5
4.7
(4.1)
(5.3)
8.7
Diluted earnings per share
7.1
4.7
(4.1)
(5.3)
8.7
Ordinary dividend per share
5.00
2.50
1.25
-
0.50
Cash per share
91.4
69.0
52.7
42.7
14.3
Net asset per share
117.5
112.8
106.3
99.8
108.8
Other Information
Return on shareholders' equity
6%
4%
-4%
-5%
5%
Return on assets
7%
5%
-4%
-5%
5%
Dividend cover
1.5
1.9
-3.3
N/A
17.4
Stock Information*
Number of shares on issue ('000)
184,614 202,878 202,878 202,878 202,878
Highest/lowest share price (cents)
167.5/120.0 132.5/90.5 99.5/54.5 76.0/56.0 64.0/42.5
Year-end share price (cents)
125.0
94.5
61.5
63.0
43.0
Year-end market capitalisation ($'m)
230.8
191.7
124.7
127.8
87.2
* Numbers are adjusted based on revised numbers of shares as a result of share consolidation in May 2016
14
B A K E R T E C H N O L O G Y
L I M I T E D