37
ANNUAL REPORT 2015
36
BAKERTECHNOLOGYlimited
FIVE-YEARFINANCIALHIGHLIGHTS
2015
2014
2013
2012
2011
FinancialPerformance ($’000)
Revenue
54,064
86,272
83,299
98,244
81,147
Grossprofit
15,219
22,707
23,768
25,084
23,510
Shareof results from joint venture / associates
–
–
(495)
587
(247)
Recognitionof deferredgainondisposal of subsidiary
–
–
58,237
–
Gainondisposal of associates
–
–
8,757
10,894
–
Pre-taxprofit
11,124
16,326
26,080
84,799
10,630
Pre-taxprofit*
11,124
16,326
17,818
15,081
10,877
Profit after tax
9,164
13,517
22,373
81,591
7,631
FinancialPosition ($’000)
Total assets
246,066
236,049
256,169
292,485
267,375
Cashand short-termdeposits
140,070
168,685
205,871
173,902
169,277
Loansandborrowings
–
–
–
3,678
–
Deferredgainondisposal of subsidiary
–
–
–
–
58,237
Net current assets
192,481
188,526
222,902
225,358
129,922
Shareholders’ equity
228,913
216,901
239,843
268,143
171,791
PerShareData (cents)
Earningsper share
0.9
1.5
2.7
11.5
1.1
DilutedEarningsper share
0.9
1.4
2.4
8.3
0.8
OrdinaryDividendper share
0.5
1.0
1.0
1.5
1.0
Special Dividendper share
–
–
4.0
8.5
–
Cashper share
13.8
18.3
23.6
23.6
24.2
Net asset per share
22.6
23.5
27.5
36.4
24.5
Other Information
Returnon shareholders’ equity
4%
6%
9%
30%
4%
Returnonassets
5%
7%
10%
29%
4%
Dividend cover
1.8
1.5
0.5
1.2
1.1
Averagenumber of employees
272
171
130
145
116
Revenueper employee
199
505
641
678
700
Stock Information
Number of shareson issue (‘000)
1,014,390
923,070
872,141
736,807
700,169
Highest/Lowest shareprice (cents)
26.5/18.1
33.5/24.0
45.0/25.5
34.5/25.0
44.5/23.5
Year-end shareprice (cents)
18.9
25.0
27.0
32.5
24.5
Year-endmarket capitalisation ($’m)
191.7
230.8
235.5
239.5
171.5
*Excluding shareof results from joint ventures / associatesandgains fromdisposal of subsidiary / associates
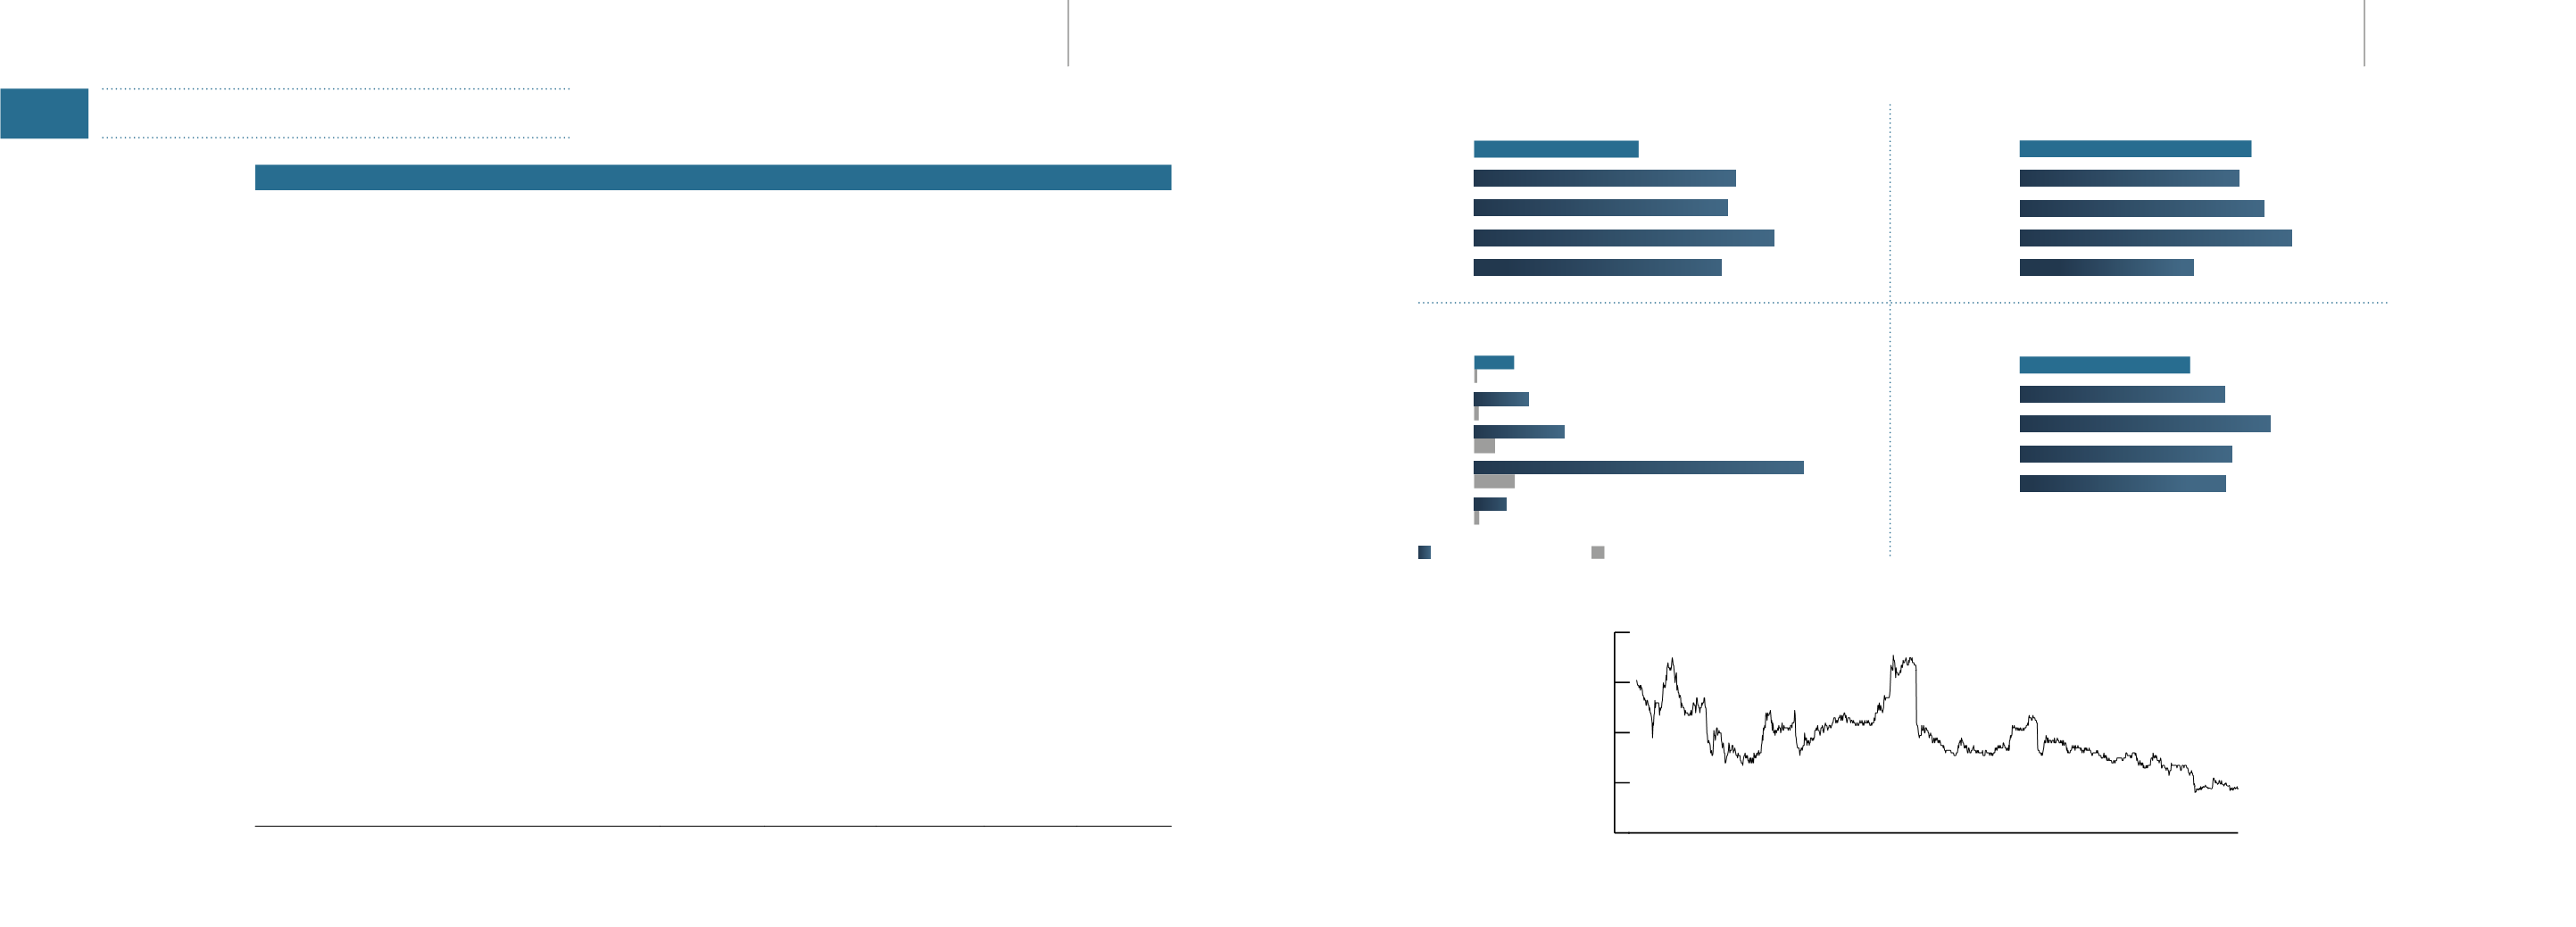
FY2011
FY2012
FY2013
FY2014
FY2015
FY2011
FY2012
FY2013
FY2014
FY2015
FY2011
FY2012
FY2013
FY2014
FY2015
FY2011
FY2012
FY2013
FY2014
FY2015
81,147
98,244
86,272
83,299
54,064
5-YEARREVENUE ($’000)
171,791
268,143
216,901
239,842
228,913
5-yearShareholders’ Equity ($’000)
169,277
173,902
168,685
205,871
140,070
5-yearCash&Short-termdeposits ($’000)
22,373
5.0
7,631
1.0
81,591
10.0
13,517
1.0
9,164
0.5
5-yearProfitaftertaxAndDividendPay-out
5-yearSHAREPRICEPERFORMANCE ($)
Profit After Tax ($’000)
DividendPay-out (cents)
FY2011
FY2012
FY2013
FY2014
FY2015
0.1
0.2
0.3
0.4
0.5


