41
ANNUAL REPORT 2015
40
BAKERTECHNOLOGYlimited
FINANCIALREVIEW
The Group’s non-current assets increasedmainly due to the acquisition of new
leasehold property and plant and machinery by its subsidiaries to boost their
production capabilities for the construction of the self-propelledmulti-purpose
jackup liftboat.
Net current assets saw a slight increase of 2%. Approximately 90% of the
Group’s current assets comprised of cash, short-term deposits and investment
securities ($141.4 million), and work-in-progress for the self-propelled multi-
purpose jackup liftboat ($47.1 million). The Group has no borrowings as at
31December 2015and31December 2014.
Share capital increased by 14% due to the $13.2 million of proceeds from the
conversion of warrants. As a result of the increase in capital base, the Group’s
net asset valuepershare reduced from23.5centsat theendof 2014 to22.6cents
by end2015.
BalanceSheets
2015
$’000
2014
$’000
Changes
%
Non-current assets
Property, plant andequipment
18,076
9,305
+94%
Intangibleassets
9,747
9,764
–
Investment securities
8,399
8,288
+1%
Deferred taxassets
360
1,018
-65%
36,582
28,375
+29%
Current assets
209,484
207,674
+1%
Current liabilities
(17,003)
(19,148)
-11%
Net current assets
192,481
188,526
+2%
Non-current liabilities–deferred
tax liabilities
150
–
NM
Net assets
228,913
216,901
+6%
Share capital
108,788
95,547
+14%
Reserves
120,125
121,354
-1%
Shareholders’ equity
228,913
216,901
+6%
*NMdenotesNotMeaningful.
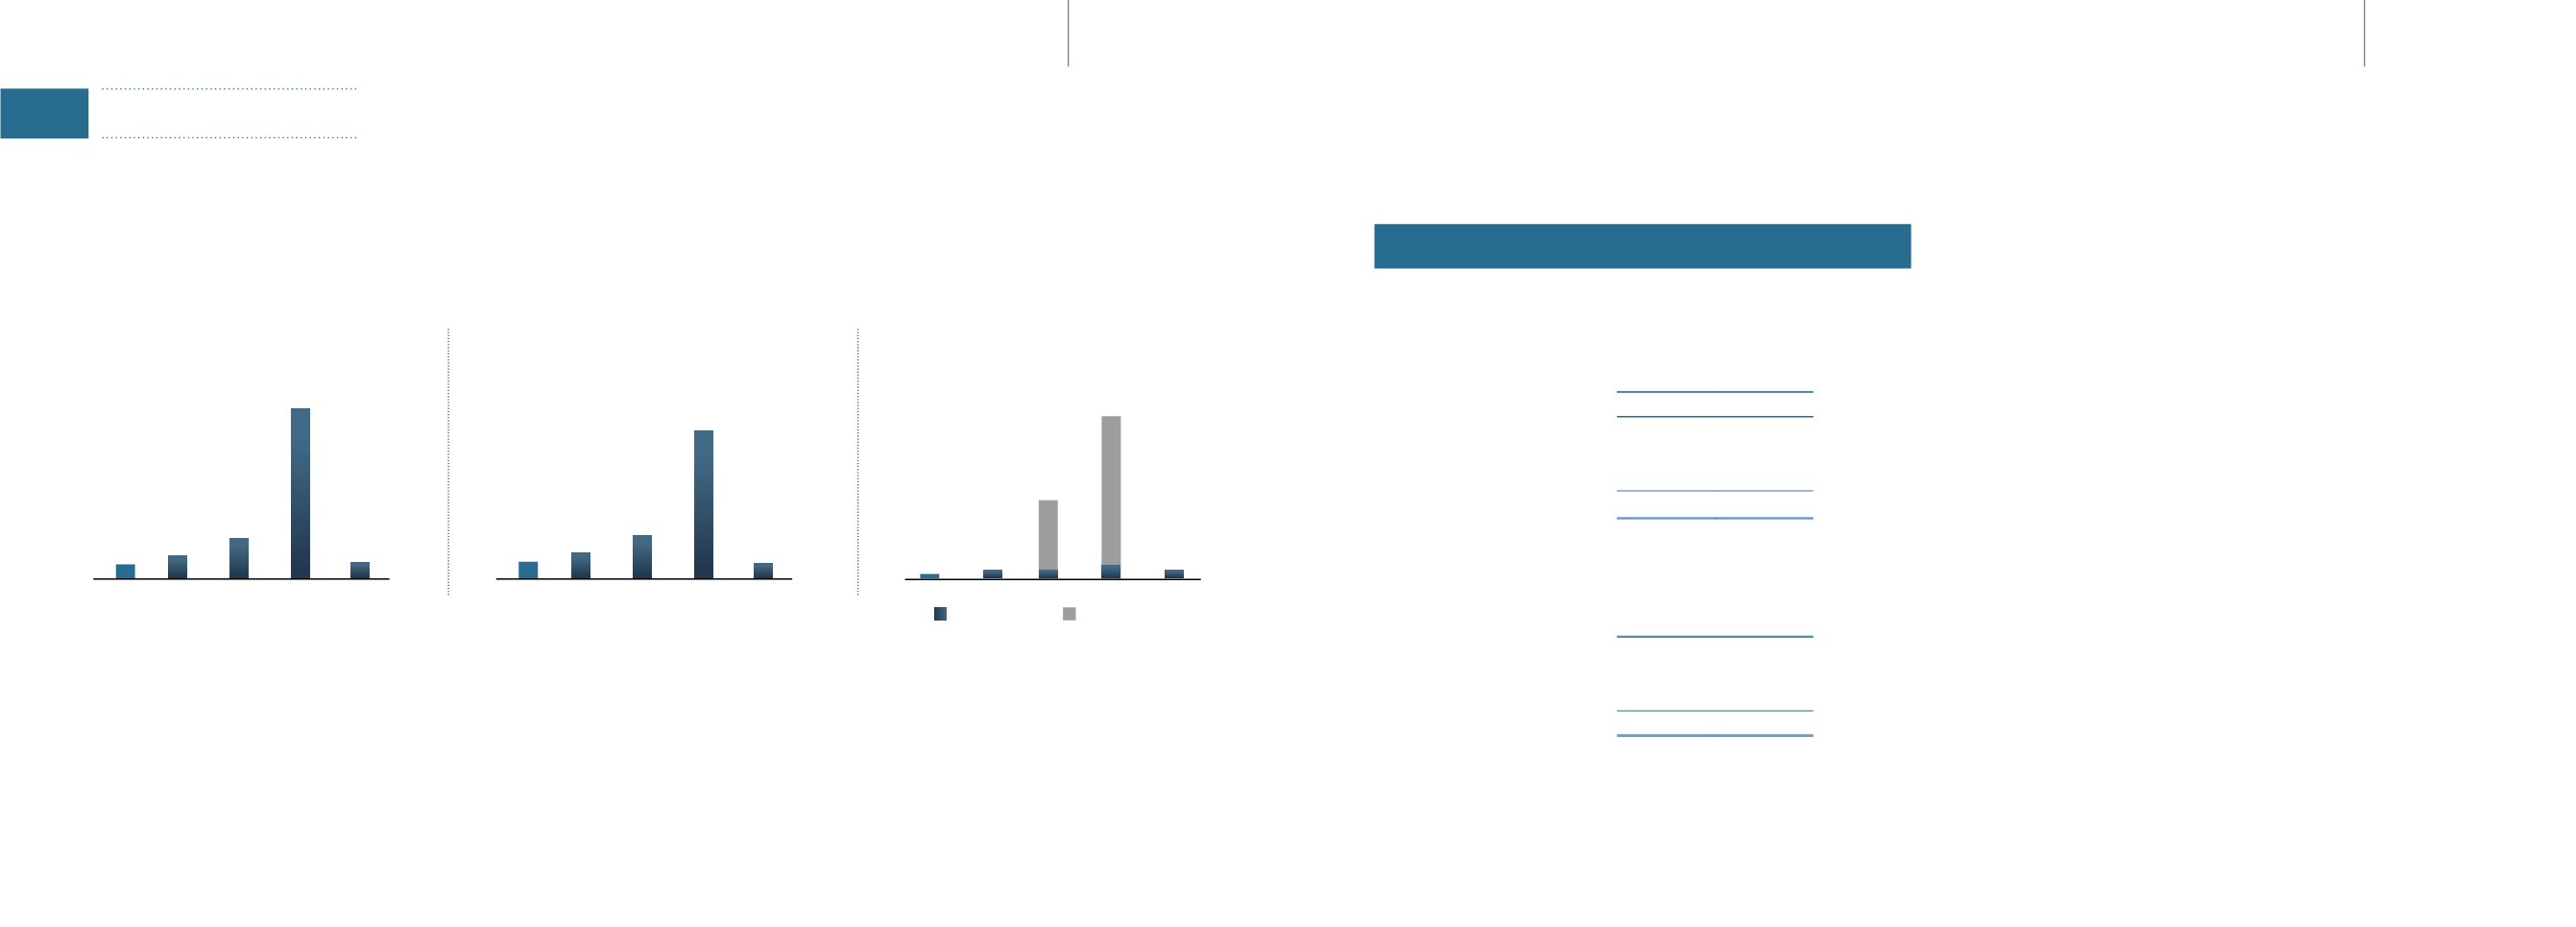
BasicEarningsPerShare (Cents)
DilutedEarningsPerShare (Cents)
DividendPerShare (Cents)
FY2011
FY2012
FY2013
FY2014
FY2015
0.9 1.5
2.7
11.5
1.1
FY2011
FY2012
FY2013
FY2014
FY2015
0.9 1.4
2.4
8.3
0.8
FY2011
FY2012
FY2013
FY2014
FY2015
0.5 1.0 1.0
5.0
4.0
8.5
10.0
1.0
OrdinaryDividend
SpecialDividend
1.5


