39
ANNUAL REPORT 2015
38
BAKERTECHNOLOGYlimited
OVERVIEW
Baker Tech recorded ahigher netmarginof 17.0% for FY2015despite a lower revenueof $54.1million and anet profit of $9.2million as compared to anetmarginof
15.7%anda revenueof $86.3millionwithprofit of $13.5million for FY2014. The lower revenueandnet profit earned isattributed topersistently lowprices for oil and
the slowdownof theoil andgas industry.
In 2014, theGroup, through itswholly-owned subsidiary, Baker Engineering, forayed into the less volatile oil productionmaintenance segment, where liftboats have
beengainingpopularity.
Baker Engineering hasmade significant progress with the construction of its state-of-the-art self-propelledmulti-purpose jackup liftboat which is expected to be
completedby the secondhalf of 2016.
MARINEOFFSHORE
2015
$’000
2014
$’000
%Change
Revenue
54,064
86,272
-37%
Net Profit
9,164
13,517
-32%
With the reduction inexplorationandproduction spendingand significant reduction innewbuilds, theGroupwitnessedadecline in revenueduringFY2015.
OPERATINGREVIEW
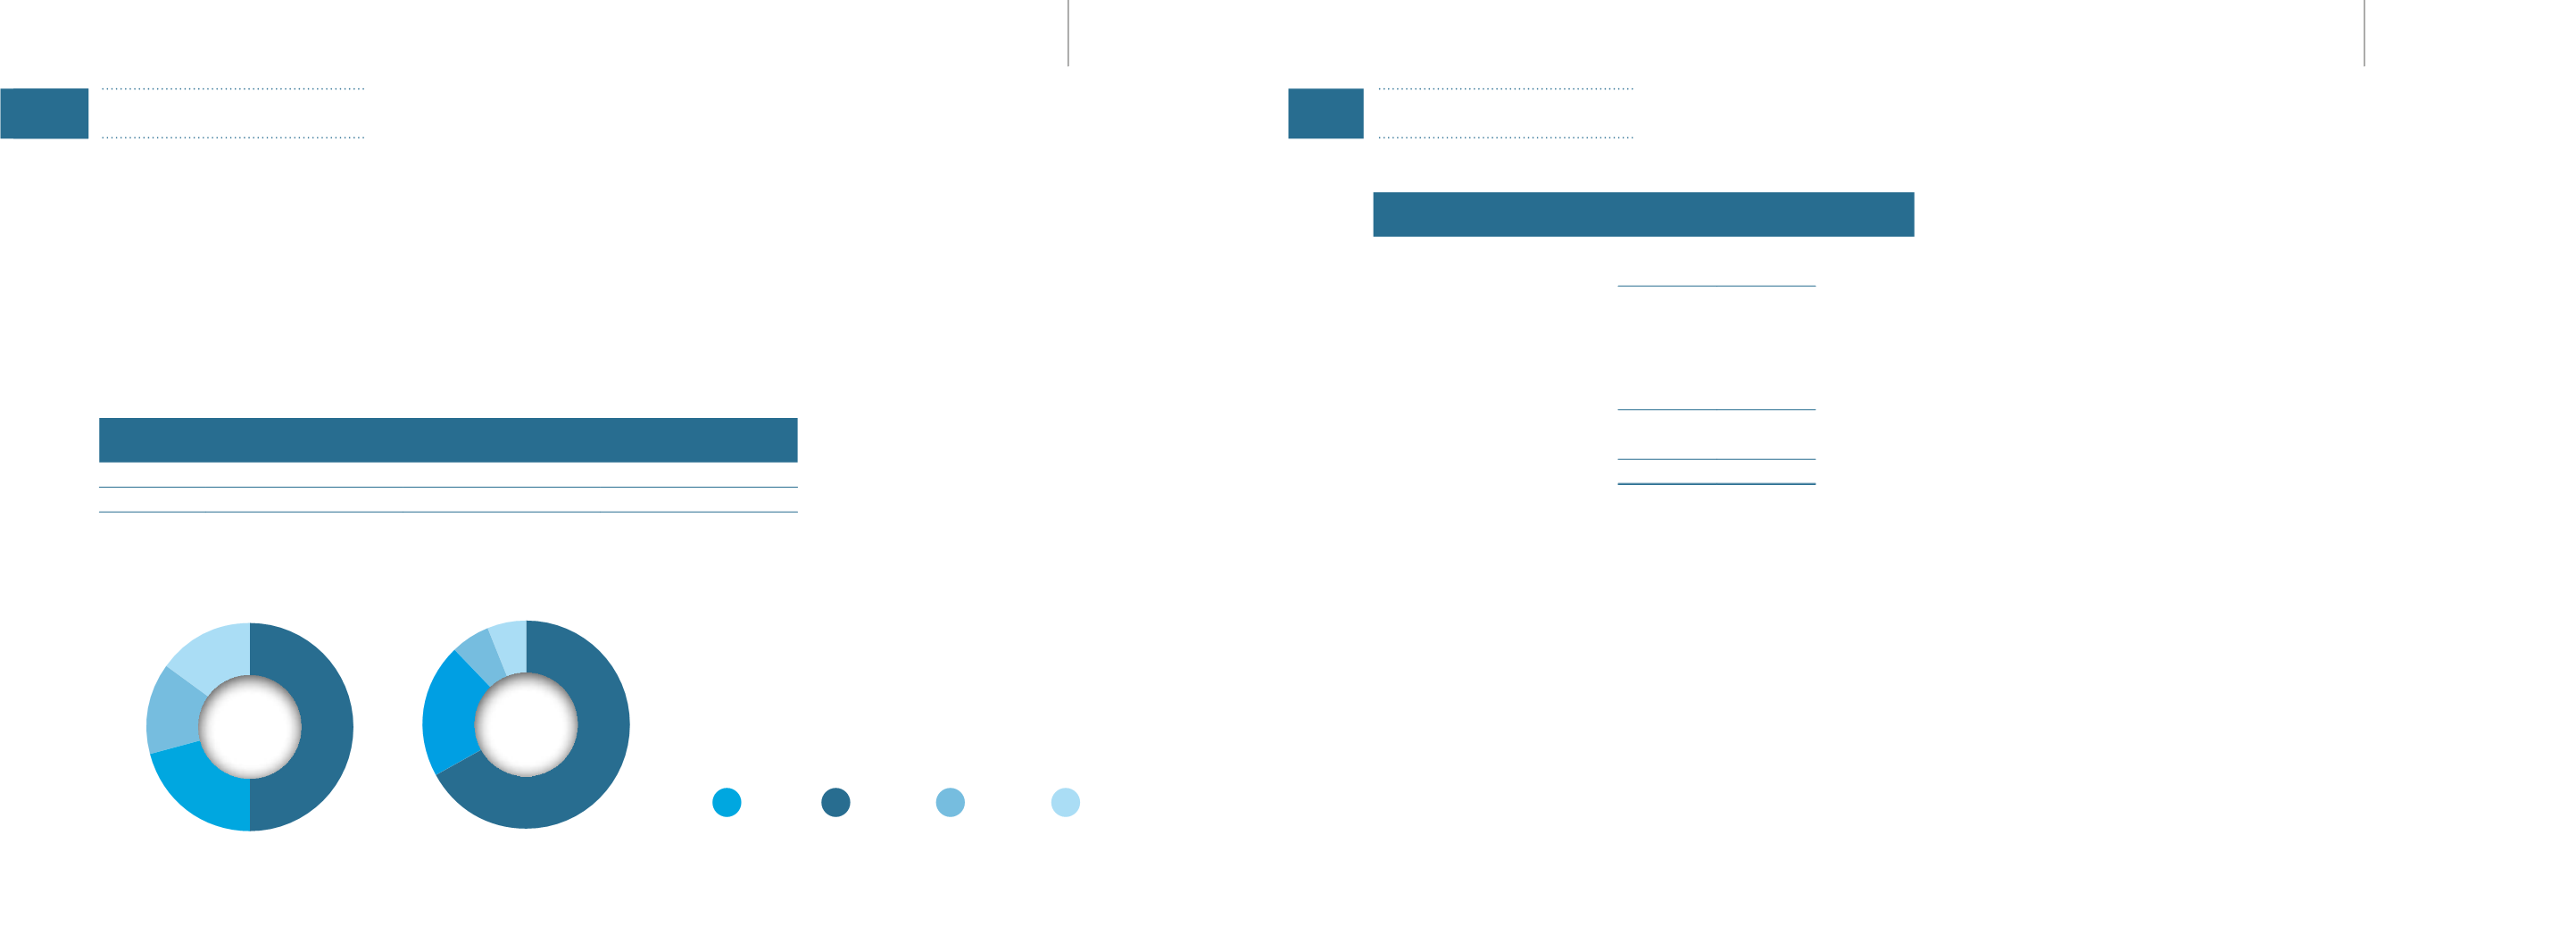
China and Singapore are the twomost importantmarkets for the Group’s
marine offshore business, although contribution fromChina has shown a
drop from67% inFY2014 to50% inFY2015.
The Group continues to diversify into other countries beyond China and
Singapore and is pleased to report that it has recorded higher revenue in
AsiaPacificandMiddleEast inFY2015, contributingalmost 30%of revenue
compared to12% in theprevious year.
RevenueByGeographicalArea
China
Singapore
AsiaPacific
(excludingChina&Singapore)
MiddleEast
50%
15%
FY2015
14%
21%
67%
6%
6%
21%
FY2014
The operating conditions of the oil and gas industry remains challenging as
demandhas takena significant hitwithdecliningoil prices since the secondhalf
of FY2014.
Due to the longproject lengths, therewasa lag timebefore the impact ofweaker
demandwas felt by theGroup. Revenue forH12015outperformedH12014while
revenue for H2 2015 significantly underperformedH2 2014with FY2015 revenue
falling37% to$54.1million.
Baker Tech recorded a foreign exchange gain of $5.3 million in FY2015 as
compared to $3.6million in FY2014 which was due to the strengthening of the
US dollar against theSingapore dollar. TheUS dollar appreciated approximately
7.0%and4.8%against theSingaporedollar inFY2015andFY2014, respectively.
With the decrease in revenue, pre-tax profit saw a reduction of 32% to $11.1
million inFY2015withgrossmargin increasingslightly. Basicearningsper share
were0.9 cent forFY2015as compared to1.5 cents forFY2014.
TheDirectorshave recommendedafirst andfinal tax-exempt (one-tier) dividend
of 0.5 cent per share to be paid for the year ended 31 December 2015. This is
subjected to shareholders’ approval at the forthcoming Annual General Meeting
of theCompany.
IncomeStatement
2015
$’000
2014
$’000
Changes
%
Revenue
54,064
86,272
-37%
Cost of goods sold
(38,845)
(63,565)
-39%
Grossprofits
15,219
22,707
-33%
Other operating income
1,123
995
+13%
Foreignexchangegain
5,322
3,647
+46%
Administrativeexpenses
(10,540)
(11,023)
-4%
Profit before tax
11,124
16,326
-32%
Income taxexpenses
(1,960)
(2,809)
-30%
Profit after tax
9,164
13,517
-32%
GrossProfitMargin
28%
26%
FINANCIALREVIEW


