Cash Flows
T
heGroup reported a
negativecashflow from
operating activities in2017
predominantlydue tohigher
workingcapital requirements,
especially for theconstruction
of the liftboat.
In2017, positivecashflow from
investing activitieswas at $2.0
millionby virtueof thematurities of
investment securities ($3.0million).
Baker Techhas incurred lower
capital expenditure at $0.7million
in FY2017 as compared to
$2.0million in2016.
Cashused infinancing activities
of $2.5million in2017was for
thepayment of dividend to
shareholders at 1.25cents per
share. For FY2016, theGroup
paiddividend to shareholders at
2.5cents per share.
TheGroup’s cashposition remains
strongat $86.6millionas at theend
of 2017, or at 42.7centsper share.
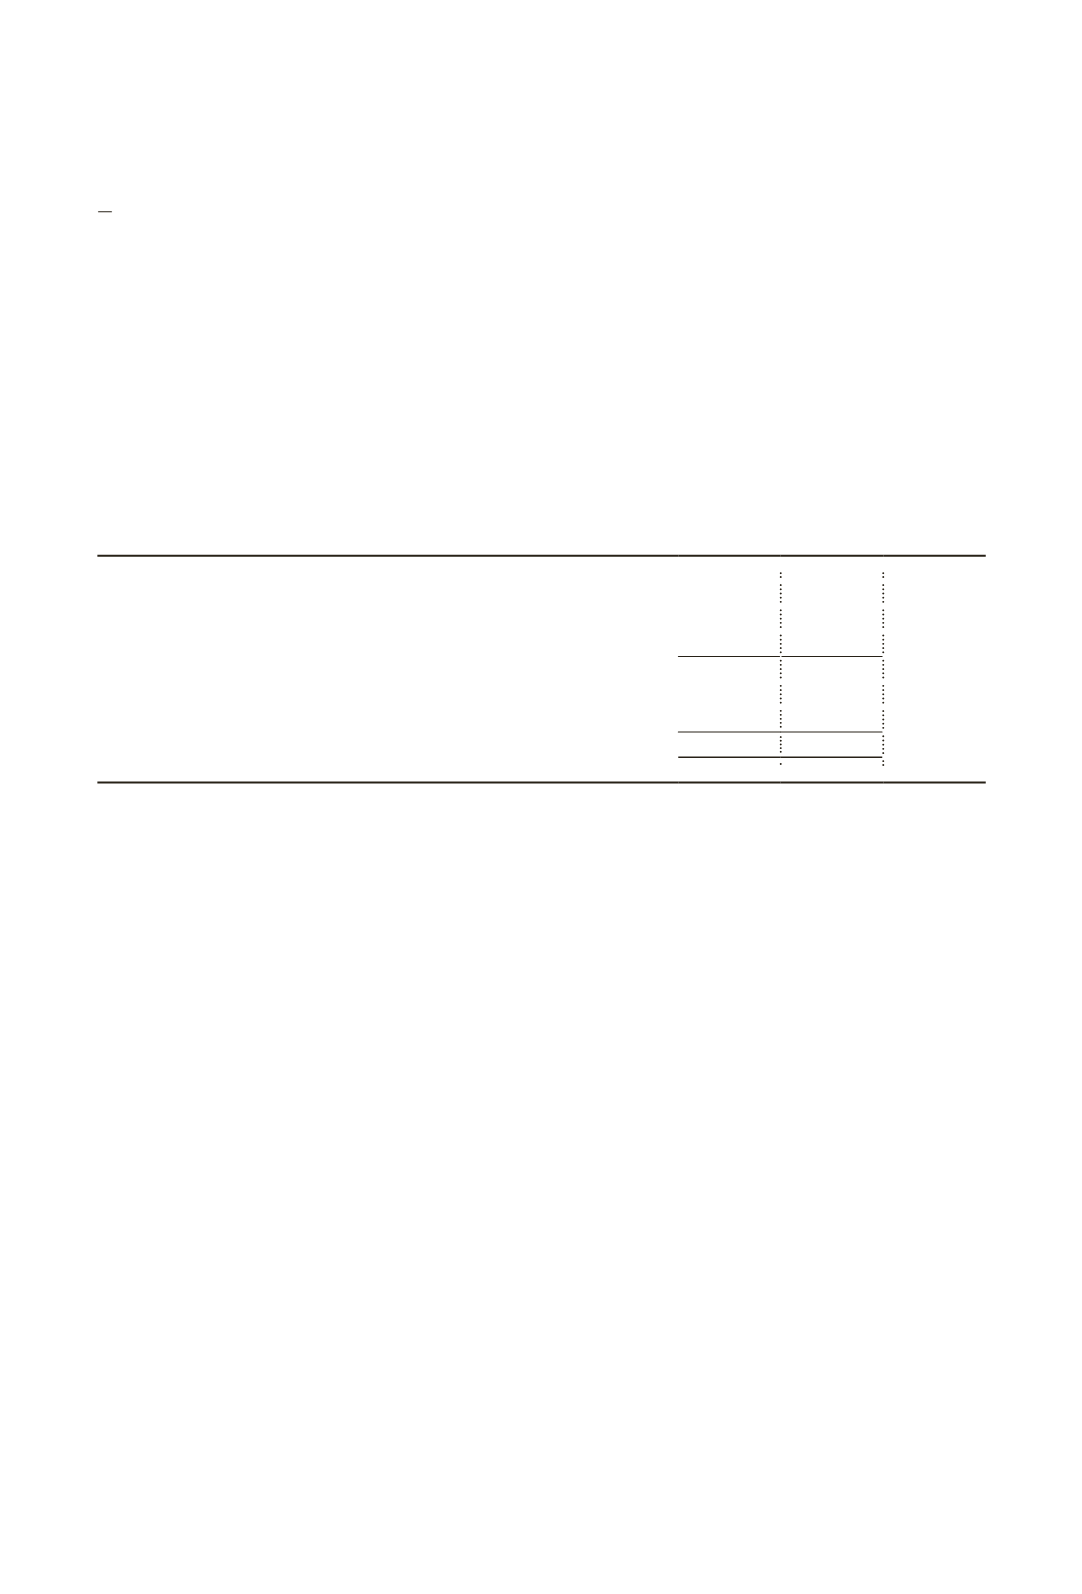
2017
2016 Change
$’000
$’000
%
Cashused inoperating activities
(16,363)
(30,223)
-46%
Cash from investing activities
1,986
1,296
+53%
Cashused infinancing activities
(2,536)
(5,072)
-50%
Net decrease incash andcashequivalents
(16,913)
(33,999)
-50%
Effect of exchange ratechanges oncash andcashequivalents
(3,401)
885
NM
Cash&cashequivalents at beginningof year
106,956
140,070
-24%
Cash&cashequivalents at endof year
86,642
106,956
-19%
* NM denotes Not Meaningful
Financial
Review
BAKER
Technology
L IMI TED
THE BE ST
I N US
. 3 0


